
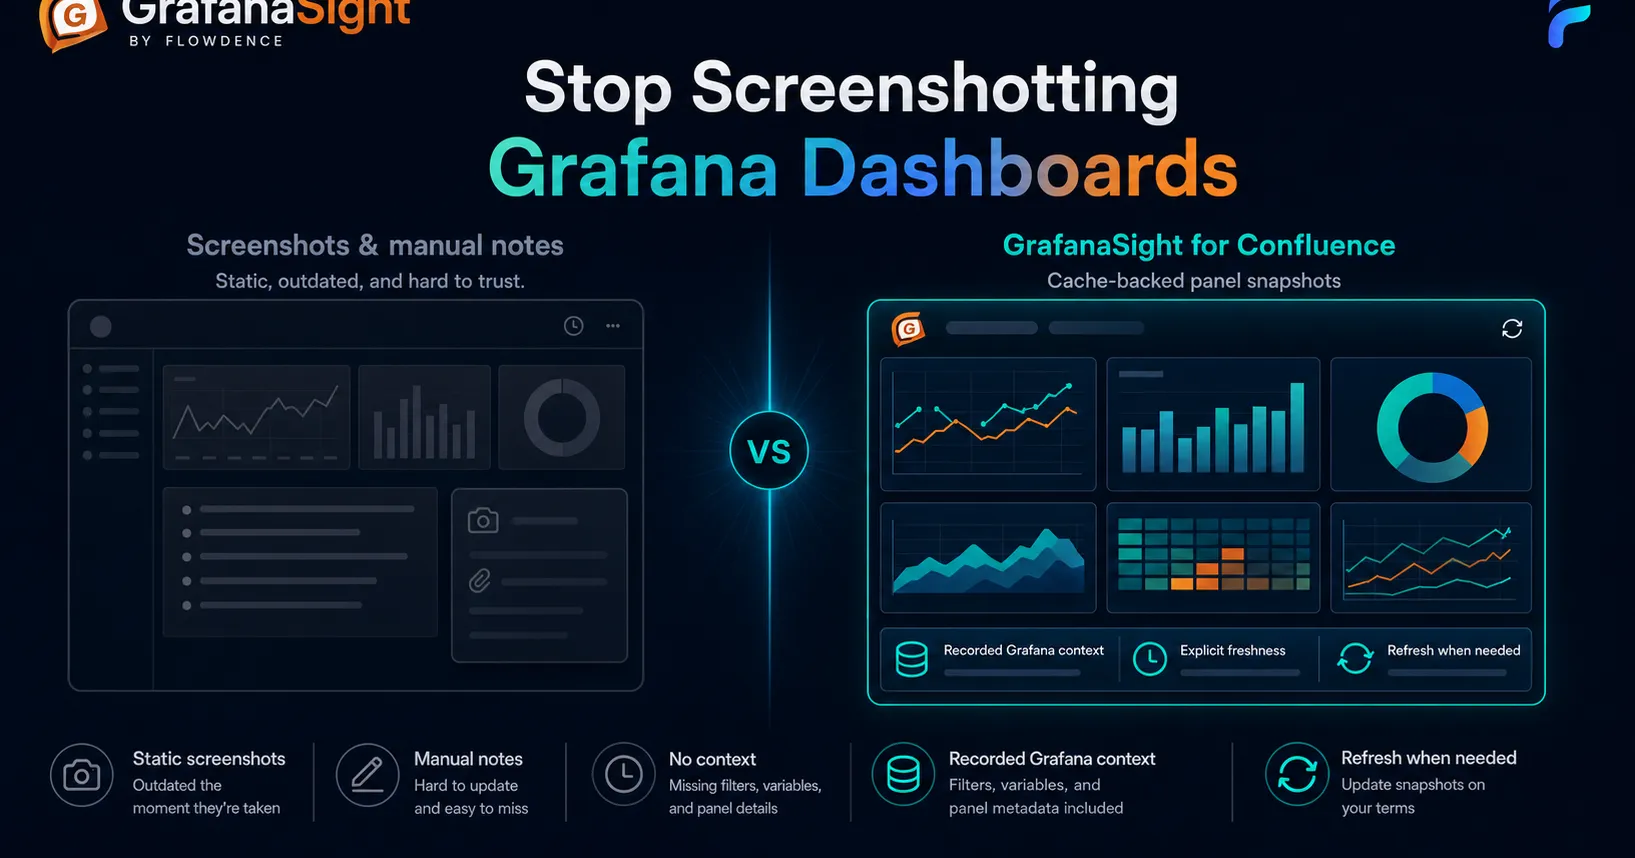
This post is for SREs, DevOps engineers, and documentation owners who maintain technical runbooks and architecture pages in Confluence alongside Grafana Cloud or self-hosted Grafana dashboards.
If you have ever pasted a screenshot of a Grafana panel into a Confluence page and thought “close enough,” you already know what happens next. A deployment rolls out. Alert thresholds change. Someone scales the infrastructure. The screenshot stays frozen in time while everything it described moves on without it.
This is not a team discipline issue. It is a structural mismatch between how observability data works and how documentation stores information. And it has a fix.
The Screenshot Problem
Grafana dashboards are live instruments. Metrics flow in continuously. Alert rules fire and resolve. Panels are added, thresholds are adjusted, and dashboard variables are reconfigured as infrastructure evolves. A screenshot of a Grafana panel captures exactly one moment — and that moment is over before the screenshot is saved.
Here are the patterns that show up repeatedly in teams that document their observability stack in Confluence:
Screenshots of dashboards that no longer match reality. Someone captured a service overview panel six months ago. Since then, the team added three new panels, changed the time series aggregation, and moved the dashboard to a different folder. The screenshot still shows the old layout with old data ranges. An on-call engineer opening the runbook during an incident sees a dashboard that no longer exists in that form.
Copy-pasted alert rules that have been reconfigured. A runbook says the HighErrorRate alert fires when the 5xx rate exceeds 5% over a 5-minute window. The team changed the threshold to 3% and the window to 10 minutes last quarter. Nobody updated the runbook. An engineer triaging the alert looks at the documented threshold, sees the current rate at 4%, and assumes the alert is a false positive.
Architecture pages with phantom services. The platform overview references four Grafana dashboards — one per service tier. One dashboard was renamed during a reorganization, another was archived when the service it monitored was decommissioned. The architecture page still links to the old names and includes a section about a service that no longer exists.
Incident postmortems with stale panel snapshots. The postmortem references a Grafana panel showing the error spike during the incident. Six months later, someone reviews the postmortem to understand a recurring issue. The screenshot shows a time range that no longer renders the same data because retention policies have rolled off the original metrics.
Why manual updates do not work
The standard response is “we need to keep our runbooks updated.” This does not work for observability documentation for three reasons:
-
Observability data changes faster than any documentation cycle. Grafana dashboards reflect infrastructure state that shifts with every deployment, scaling event, and configuration change. No manual process can keep pace.
-
The people who change dashboards are not the people who maintain docs. The SRE adjusting alert thresholds and the technical writer maintaining the runbook page are rarely the same person. There is no reliable feedback loop between “I changed a Grafana dashboard” and “someone should update the Confluence page.”
-
Stale observability docs are invisible until an incident. A Confluence page with an outdated Grafana screenshot looks identical to one with a current screenshot. You discover the gap at the worst possible moment — when someone trusts the page during a production incident.
The most dangerous runbook is one that looks current but isn’t. Teams trust it, act on it, and discover the gap only when something breaks at 3 AM.
What Stale Dashboard Documentation Costs
Documentation staleness in the observability layer is not just an inconvenience. It has measurable downstream effects:
Longer incident resolution times. When an on-call engineer opens a runbook and the documented dashboard layout, alert thresholds, and service dependencies do not match the current state, they spend the first critical minutes reconciling documentation with reality instead of diagnosing the problem.
Onboarding confusion. New SREs build their mental model of service health from documentation. When runbooks reference dashboards that have been reorganized, alerts that have been reconfigured, or services that no longer exist, new hires develop an incorrect understanding of the system they are about to be on-call for.
Architecture review inaccuracy. Quarterly reviews that reference Confluence pages with six-month-old Grafana screenshots are making capacity planning and reliability investment decisions against a stale snapshot of the infrastructure.
Shadow knowledge silos. When teams learn they cannot trust the wiki, they stop writing things down. Institutional knowledge moves into Slack threads and individual heads. The documentation problem becomes a knowledge management problem.
How to Embed a Grafana Dashboard in Confluence
The core insight is the same one that applies to any fast-changing data source: documentation should pull from the source of truth rather than store a static copy.
GrafanaSight for Confluence does exactly this. It is a Forge-native Confluence Cloud app that converts supported Grafana URLs into live macros — panels, dashboards, alerts, and annotations rendered directly in your Confluence pages and refreshed on demand.
GrafanaSight is a Flowdence product and is not affiliated with, endorsed by, or sponsored by Grafana Labs.
Paste a URL, Get a Live Panel
When you paste a supported Grafana panel URL or dashboard URL into a Confluence page, GrafanaSight auto-converts it into a live macro. No manual macro insertion required.
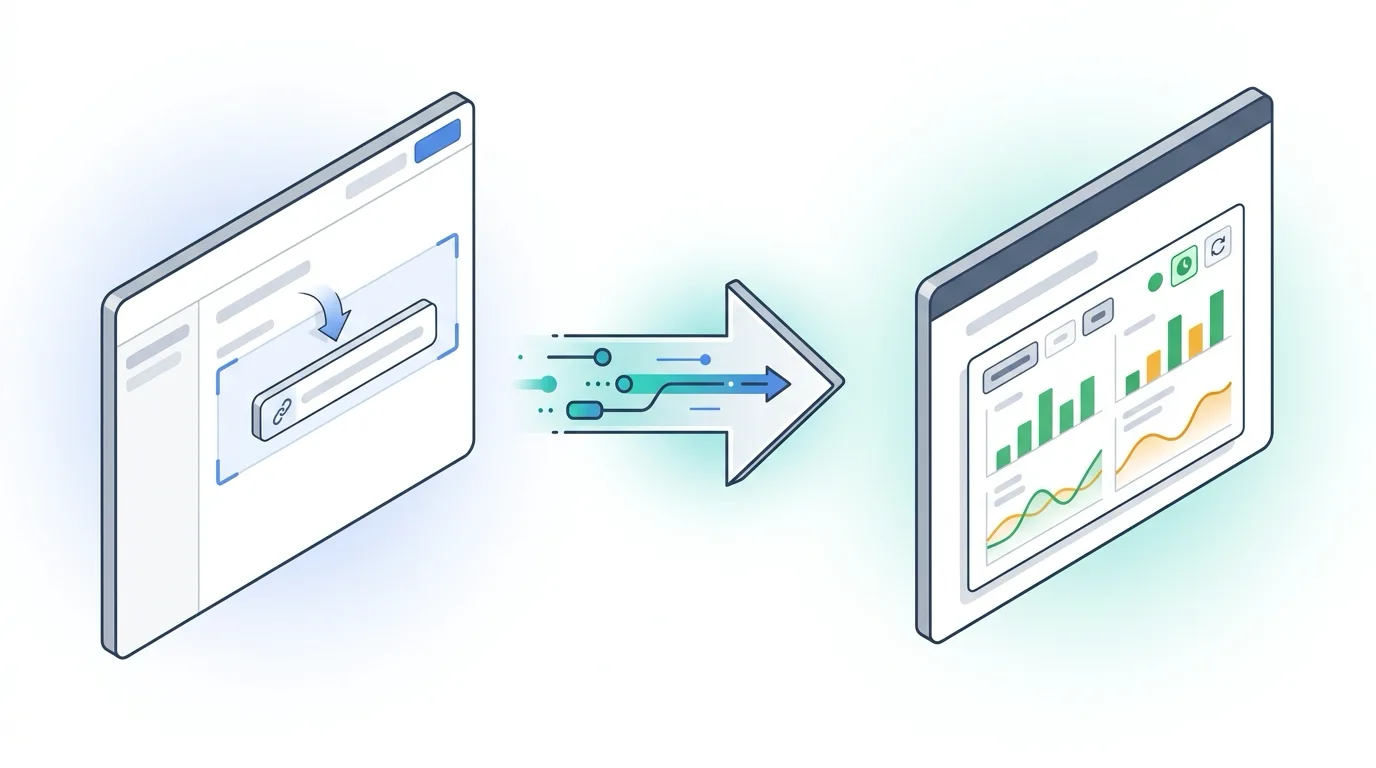
A panel URL becomes a Panel Macro that renders the panel as a PNG snapshot with time range controls — 1h, 6h, 24h, 7d, and 30d — so readers can adjust the window without leaving Confluence. Both detailed and compact views are available. Template variables from the original dashboard URL are preserved.
A dashboard URL becomes a Dashboard Overview Macro showing the dashboard name, panel count, tags, folder, and last modified timestamp. Detailed and compact layout options let you choose the right level of information density for the page.
Each macro includes a Refresh button for on-demand updates and a freshness timestamp showing when data was last fetched. GrafanaSight uses a cache-first architecture with background refreshes, so Confluence page loads stay fast and the connected Grafana instance is not called every time someone opens a runbook.
If you prefer to configure macros manually, GrafanaSight provides a configuration picker with a URL fallback option.
Current panel snapshot with relative and absolute time ranges.
Dashboard name, panel count, tags, folder, and metadata.
Firing, pending, and normal alerts with state and severity filters.
Compact service health for runbooks and catalog tables.
Grafana annotation events for incident and change context.
Alert Visibility Without Grafana Access
Not everyone who needs to know about service health has — or should have — a Grafana login. GrafanaSight brings alert visibility into Confluence where the rest of the team already works.
The Alert Summary Macro displays a tabular view of active Grafana alerts with state, severity, and label filtering. Firing, pending, and resolved alerts are shown with color-coded badges so the current situation is visible at a glance. Drop this macro into a service runbook and the alert section stays current without anyone manually updating it.
The Status Badge Macro is an inline health indicator designed for runbooks and service catalogs. It shows the current Grafana alert health for a service as a compact badge — green, amber, or red — that fits naturally alongside text.
The Annotation Timeline Macro renders Grafana annotation events (deployments, configuration changes, manual markers) in a timeline view, giving incident postmortems and change logs actual context from the observability layer.
The Service Health Byline adds a page-header badge showing the current Grafana alert health status for the configured service. Readers see health state the moment they open the page, before scrolling to any macro. A byline button enables page-level batch refresh of all GrafanaSight macros on the page.
What this replaces in your workflow
| Before GrafanaSight | After GrafanaSight |
|---|---|
| Screenshot of a Grafana panel pasted into Confluence | Live Panel Macro with current data and time range controls |
| Copy-pasted alert thresholds in a runbook | Alert Summary Macro showing current firing, pending, and resolved alerts |
| Manually maintained service status table | Status Badge Macros with live Grafana alert health |
| "Check Grafana" steps in incident runbooks | Panels, alerts, and annotations embedded directly in the runbook |
| "Ask the SRE what's on fire" in Slack | Anyone with Confluence access sees alert state on the page |
| Incident postmortem with stale panel screenshots | Live panel snapshots with adjustable time ranges |
| Quarterly "update the runbook screenshots" sprint | Macros refresh on demand, with background refresh keeping cached data ready |
Ask Your Grafana Data Anything
GrafanaSight includes a Rovo Agent — the GrafanaSight Specialist — that lets any Confluence user chat with their cached GrafanaSight data from anywhere in Confluence.
The agent can query cached dashboards, query cached alert state, refresh the GrafanaSight cache on request, and generate incident summary drafts. Instead of switching to Grafana to answer a question about service health, you ask the agent directly in Confluence and get an answer grounded in data from your connected Grafana instance.
This is particularly valuable during incidents when multiple people need answers about current state and not all of them have Grafana access.
Enterprise Security by Design
GrafanaSight runs on Atlassian Forge — Atlassian’s serverless compute platform — with no external Flowdence servers in the data path. It supports Grafana Cloud and Forge-reachable self-hosted HTTPS instances through customer-managed egress.
- Forge-native — runs on Atlassian infrastructure. No vendor servers, databases, or storage to manage or audit.
- Read-only — all Grafana API calls are GET-only. GrafanaSight cannot modify your Grafana instance.
- Customer-managed egress — an Atlassian administrator approves the exact Grafana HTTPS destination before GrafanaSight connects.
- Service Account token — credentials are stored in Atlassian-managed encrypted secret storage. Never exposed in logs or client-side code.
- Least-privilege scopes — only the minimal Forge scopes required to render macros; no write access to Confluence content.
- Space isolation — each Confluence space connects to one Grafana instance. Credentials are scoped per space. No cross-space data leakage.
- Cloud or self-hosted HTTPS — self-hosted instances must use a public HTTPS origin that Atlassian Forge can reach; localhost and private IP literals are not supported.
Getting Started
GrafanaSight is available on the Atlassian Marketplace. After installation:
- Open Space settings → Integrations → GrafanaSight in your Confluence space.
- Enter your Grafana HTTPS base URL (for example,
https://your-org.grafana.netorhttps://grafana.example.com). - Enter the Service Account Token from your Grafana instance. The token needs Viewer-level access.
- Save the configuration and have an Atlassian administrator approve the exact destination if prompted.
From there, paste a supported Grafana panel or dashboard URL into a Confluence page. GrafanaSight converts it into a live macro automatically.
No Grafana login is required for Confluence readers. The Service Account token is configured once by a space admin and stored in Atlassian-managed encrypted secret storage.
For full setup instructions, macro reference, and Rovo agent documentation, see the GrafanaSight documentation.
FAQ
Why do Grafana dashboard screenshots go stale in Confluence?
Grafana dashboards update continuously with new metrics, alert state changes, and infrastructure modifications. Screenshots captured at a point in time become inaccurate within hours as the underlying data changes. Deployments roll out, alert thresholds are reconfigured, panels are added or removed, and infrastructure scales up or down.
Teams relying on screenshot-based documentation work with outdated information during incidents, onboarding, and architecture reviews — exactly the moments when accuracy matters most.
How does GrafanaSight keep Grafana data current in Confluence?
GrafanaSight auto-converts supported Grafana URLs pasted into Confluence pages into live snapshot macros. Panel macros render current panel images with time range controls. Dashboard overview macros show panel counts, tags, and metadata. Alert summary macros display active alert context.
All macros include refresh buttons and freshness timestamps. A cache-first architecture with background refreshes keeps Confluence pages fast while ensuring data stays reasonably current — and users can always trigger a manual refresh on demand.
Does GrafanaSight require every team member to have Grafana access?
No. GrafanaSight uses a single Grafana Service Account token configured by a Confluence space administrator. Any Confluence user who can view the space can see GrafanaSight macros without needing their own Grafana login. This is particularly valuable for product managers, architects, and incident responders who need observability context but do not have — or should not need — direct Grafana access.
Is GrafanaSight read-only against Grafana?
Yes. GrafanaSight makes GET-only requests to the exact Grafana HTTPS destination an Atlassian administrator approves. It never writes data back to Grafana. The Service Account token is stored in Atlassian-managed encrypted secret storage and is never exposed to Confluence readers.
Related Posts
- Incident Postmortems with Live Grafana Data in Confluence
- Grafana Alerts in Confluence: Real-Time Service Health
- From Dashboard to Documentation: GrafanaSight for Platform Teams