
This post is for SREs, on-call engineers, platform teams, and documentation owners who maintain runbooks and status pages in Confluence alongside Grafana Cloud or self-hosted Grafana monitoring.
Your Grafana alerts are firing. Your team sees them in Grafana, in Slack, in PagerDuty. But the people reading your Confluence runbooks and status pages — product managers, leadership, new team members — see nothing. The page looks calm even when production is on fire.
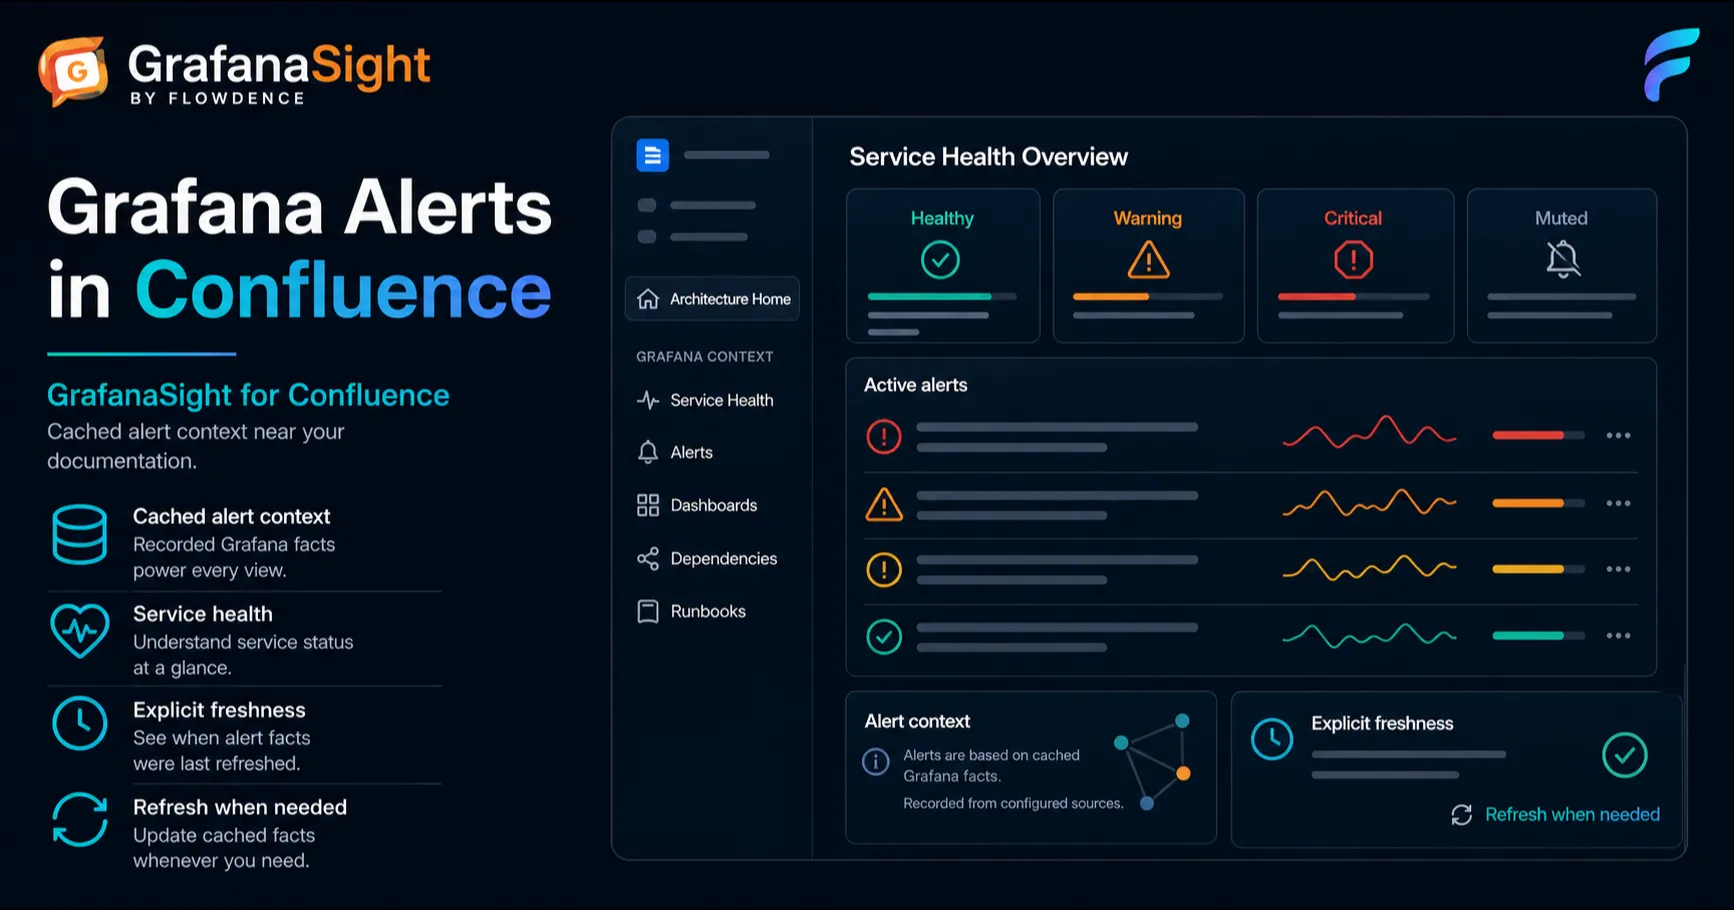
GrafanaSight for Confluence closes that gap. It surfaces alert data from Grafana Cloud or a Forge-reachable self-hosted HTTPS instance directly inside Confluence pages so that readers can see current service health without logging into Grafana.
GrafanaSight is a Flowdence product and is not affiliated with, endorsed by, or sponsored by Grafana Labs.
The Alert Visibility Gap
Grafana is where your team defines alert rules and investigates incidents. But Confluence is where your organization documents services, publishes runbooks, and reviews operational status.
These two systems have no native connection. The result is a persistent blind spot:
- Runbooks describe what to do when alerts fire but cannot show whether those alerts are currently firing.
- Status pages list services but cannot show real-time health.
- Architecture docs reference monitoring but link out to Grafana dashboards that require a login most readers do not have.
The people who need alert context most — the ones reading runbooks during incidents, reviewing status in leadership syncs, or onboarding onto a new team — are the ones least likely to have Grafana access.
GrafanaSight solves this by pulling alert data from the Grafana Alertmanager API and rendering it through Confluence macros that any page reader can see.
Alert Summary Macro
The Alert Summary macro renders a tabular view of active Grafana alerts directly in a Confluence page. Each row shows the alert name, current state (firing, pending, or normal), severity, labels, and annotations.
The macro supports four filters:
| Filter | Description |
|---|---|
| State | Show only alerts in a specific state — firing, pending, or normal |
| Severity | Filter by severity label (critical, warning, info) |
| Label query | Match alerts by arbitrary label key-value pairs |
| Max items | Limit the number of rows displayed |
Annotations from Grafana alert rules are preserved, which means summary and description text configured in your alert rules appears directly in the Confluence table. If your annotations include links — to dashboards, runbook sections, or external docs — those links render as clickable references in the macro output.
You can insert the macro by pasting the autoconvert URL flowdence.io/grafanasight/alert-summary into any Confluence page, or by searching for “Alert Summary” in the macro browser.
Inline Status Badges for Runbooks
The Status Badge macro renders a compact, inline health indicator that fits naturally inside runbook headers, callout panels, or status tables.
The badge displays one of three states:
- Healthy — no alerts firing or pending
- Degraded — one or more alerts in pending state
- Firing — one or more alerts actively firing
Behind the badge, GrafanaSight counts firing, pending, and normal alerts from the cached data and selects the worst-case state. The badge is small enough to sit alongside a service name in a table cell or a page callout without disrupting the layout.
This is useful for runbook index pages where you list services and want an at-a-glance health column, or for incident response pages where current alert state provides immediate context.
Service Health in the Page Header
The Service Health byline places an alert health indicator directly in the Confluence page header area. When readers open a page, they see service health status before scrolling — a popup showing alert state drawn from the same cached alert data.
This is particularly effective for team-owned service pages. A single byline at the top of a service’s primary Confluence page gives every visitor — engineers, PMs, leadership — immediate visibility into whether the service is currently healthy without navigating to a separate dashboard.
Ask About Alerts via AI
GrafanaSight includes a Rovo agent action that lets Confluence users ask natural-language questions about alert state. The agent accepts filters for state, severity, label query, search term, and result limit.
Example queries a user might ask through Rovo:
- “Are there any critical alerts firing right now?”
- “Show me all pending alerts for the payments service”
- “How many alerts are in a normal state?”
The agent queries the same cached alert data that powers the macros, so responses are consistent with what the page-level macros display.
Paste the alert-summary autoconvert URL or insert the macro from the browser for a filtered alert table.
Add a compact Healthy, Degraded, or Firing signal inside a runbook header or service table.
Show page-level health in the Confluence header and open the Alerts tab when readers need more detail.
Cache-First Alert Architecture
GrafanaSight uses a cache-first approach to alert data. Alert information is pulled from the connected Grafana instance through read-only API access, then cached so Confluence page loads stay fast and Grafana is not called every time someone opens a runbook.
A background sync runs automatically to keep the cached data reasonably current, even when no one has visited a page recently. Every macro displays a freshness timestamp showing when the data was last fetched, and users can trigger a manual refresh on demand.
This gives teams control over the freshness-performance tradeoff without requiring real-time connections.
All Grafana API calls are GET-only. GrafanaSight never modifies alert rules, silences, or any other Grafana resource. A single service account token, configured by a Confluence space admin, provides the data for macros and agent queries in that space. An Atlassian administrator approves the exact Grafana HTTPS destination before the app connects.
Who Benefits
Open a runbook and immediately see which alerts are firing before following the documented procedure.
Check service health on team Confluence pages without needing separate Grafana access.
Reference service pages that reflect actual alert state instead of manually compiled summaries.
Platform teams maintain fewer “is the service healthy?” Slack threads because the answer is visible on the Confluence page. New team members onboard with documentation that shows current operational state, not a stale snapshot from three months ago. Compliance reviewers can reference pages that reflect actual monitoring coverage rather than aspirational descriptions.
FAQ
Can I see Grafana alerts inside Confluence without logging into Grafana?
Yes. GrafanaSight surfaces cached alert data from the connected Grafana instance directly in Confluence. Readers can see alert state, severity, labels, and annotations without individual Grafana logins. A single service account token configured by a space admin provides the data for macros and agent queries in that space.
What alert information does GrafanaSight show in Confluence?
The Alert Summary macro shows a tabular view of active Grafana alerts with state (firing, pending, normal), severity, labels, and annotations. The Status Badge macro renders an inline health indicator (Healthy, Degraded, Firing) for runbook callouts and status tables. The Service Health byline shows alert health in the page header as a popup.
How fresh is the alert data in GrafanaSight?
Alert data is cached and refreshed automatically in the background so page loads stay fast and the connected Grafana instance is not called on every page view. Every macro displays a freshness timestamp showing when data was last fetched, and users can manually refresh alerts on demand.
Can I filter alerts by severity or labels in GrafanaSight?
Yes. The Alert Summary macro supports filtering by alert state, severity, label query, and maximum number of rows. The Rovo agent also accepts state, severity, and label query filters when querying alerts via natural language.
Related Posts
- Stop Screenshotting Grafana Dashboards
- Incident Postmortems with Live Grafana Data in Confluence
- From Dashboard to Documentation: GrafanaSight for Platform Teams