GrafanaSight™
for Confluence
Bring Grafana Cloud context into Confluence. Embed panel snapshots, dashboard metadata, active alerts, annotation timelines, and a cache-first Rovo Specialist where your team already writes runbooks and postmortems.
GrafanaSight is a Flowdence product and is not affiliated with, endorsed by, or sponsored by Grafana Labs.
GrafanaSight Specialist Rovo Agent
Ask about dashboards, firing alerts, freshness, and incident context from anywhere in Confluence. Answers stay grounded in cached GrafanaSight data and tell you when live metrics belong in an embedded panel.
Grounded observability context
Uses cached dashboards, panels, alerts, annotations, and sync health
Cache-first, explicit freshness
Reports snapshot age and explains when cached detail is incomplete
Refresh on request
Can refresh catalog or alert data after you explicitly ask for fresher context
Built on Atlassian Rovo
AI agent accessible from anywhere in Confluence
Panel snapshot macros
Embed Grafana panel snapshots in Confluence with detailed and compact layouts for runbooks, incident reports, and capacity reviews.
Incident time ranges
Use Last 15m through Last 30d presets, or lock a custom absolute From/To range so postmortems show the exact incident window.
Alerts and service health
Review cached active alerts, service-health byline status, status badges, and page-level refresh from inside Confluence.
GrafanaSight Specialist
Ask Rovo about cached dashboards, alerts, freshness, and incident-summary drafts without silent live Grafana calls.
Dashboard cache and sync health
Keep dashboard catalog, panel metadata, alerts, and annotations warm with visible sync status and actionable errors.
Forge-hosted and space-scoped
Grafana service account tokens use Forge secret storage, with egress limited to customer Grafana Cloud tenants.
From the Blog
Grafana + Confluence guides
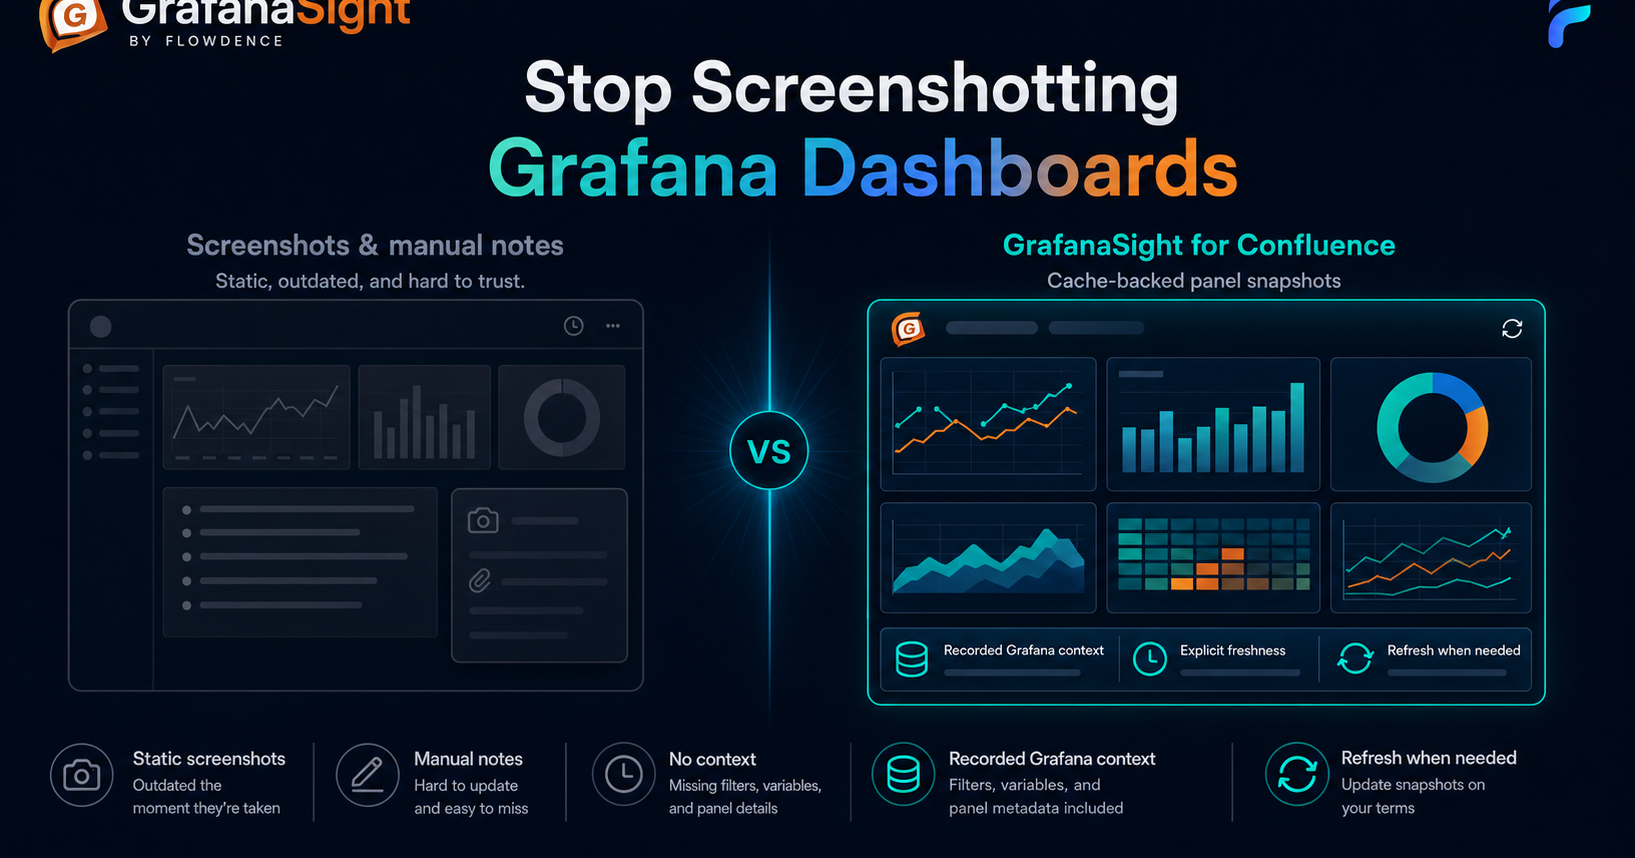
Stop Screenshotting Your Grafana Dashboards
Replace static screenshots with GrafanaSight panel snapshots, explicit freshness, and refreshable Confluence context.
Read more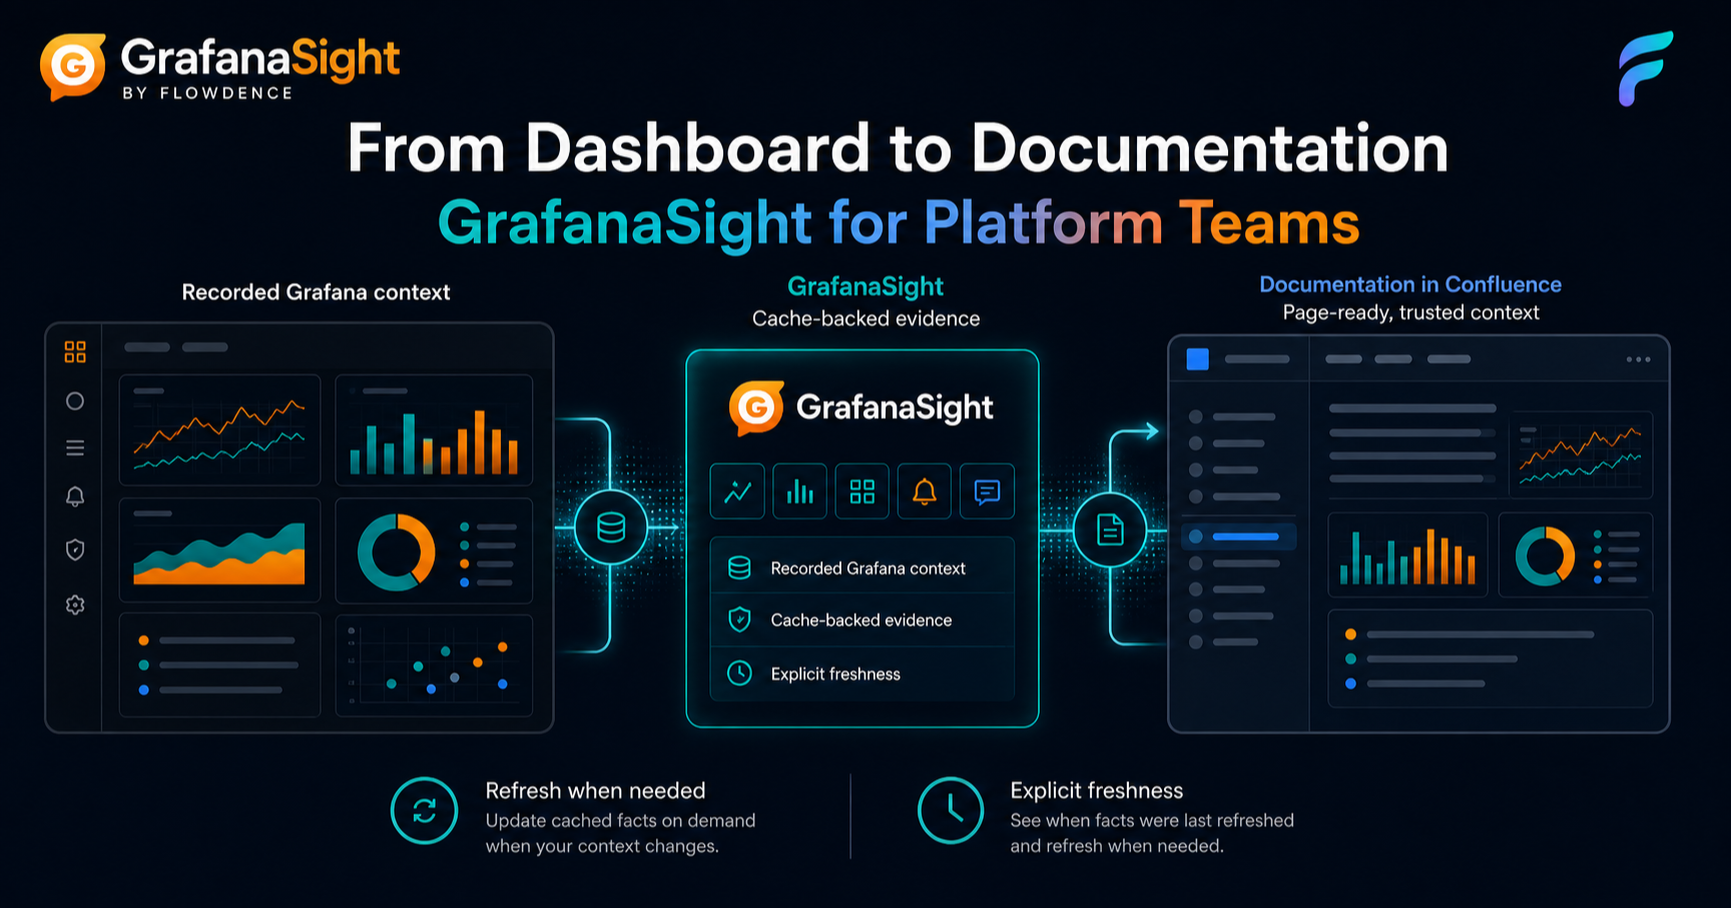
From Dashboard to Documentation: GrafanaSight for Platform Teams
Bridge Grafana Cloud dashboards, alerts, and annotations into the Confluence pages where teams explain systems.
Read more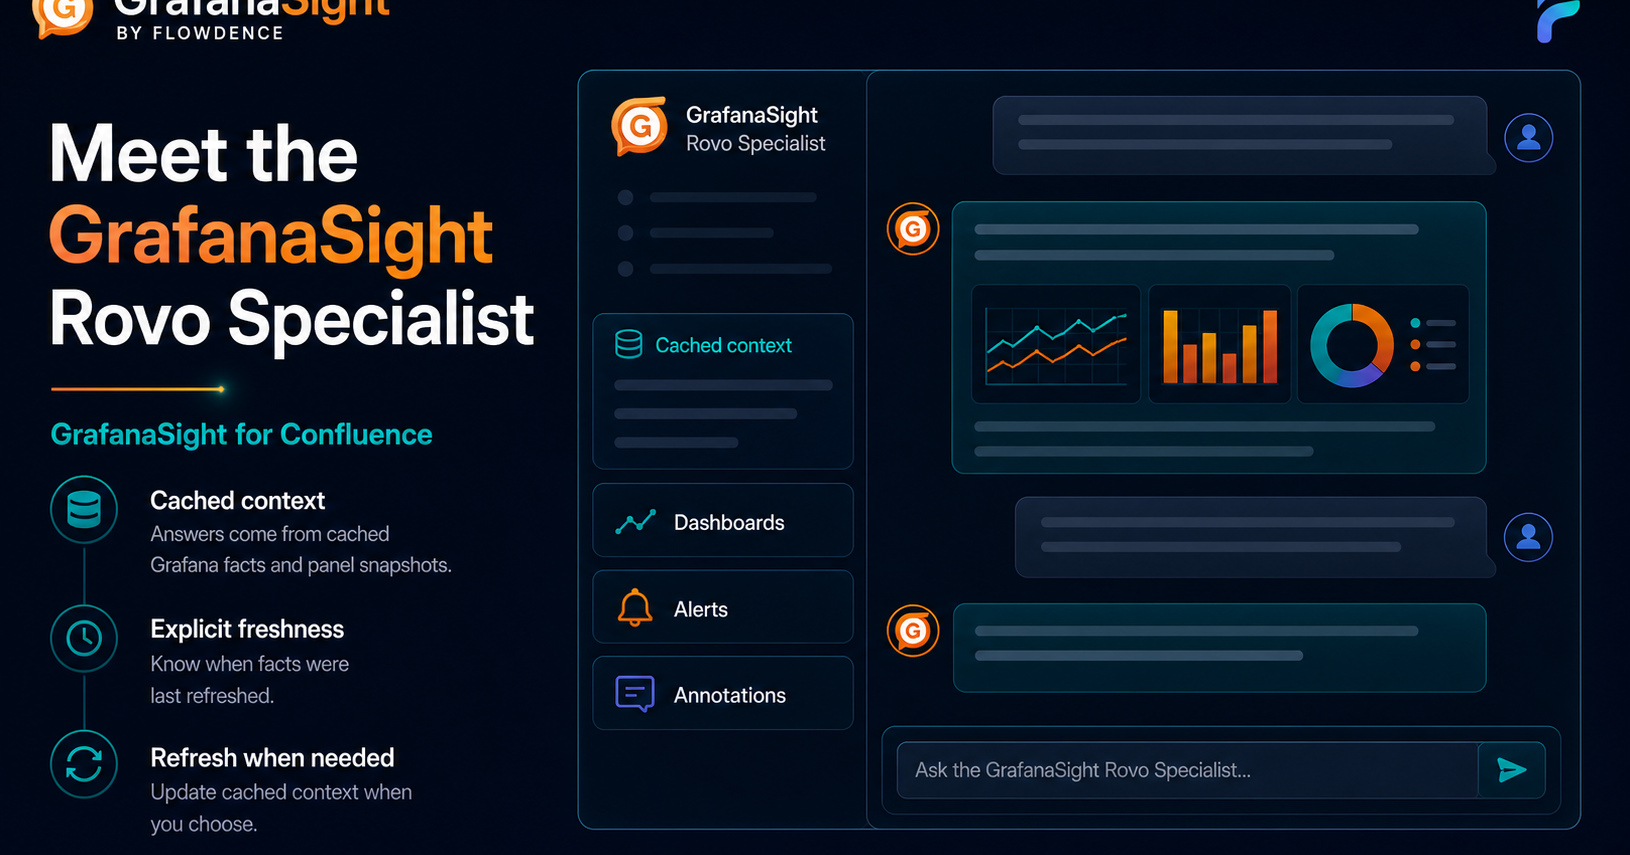
Meet the GrafanaSight Rovo Specialist
See how a cache-first Rovo Specialist answers from GrafanaSight dashboard, alert, and freshness context.
Read more