
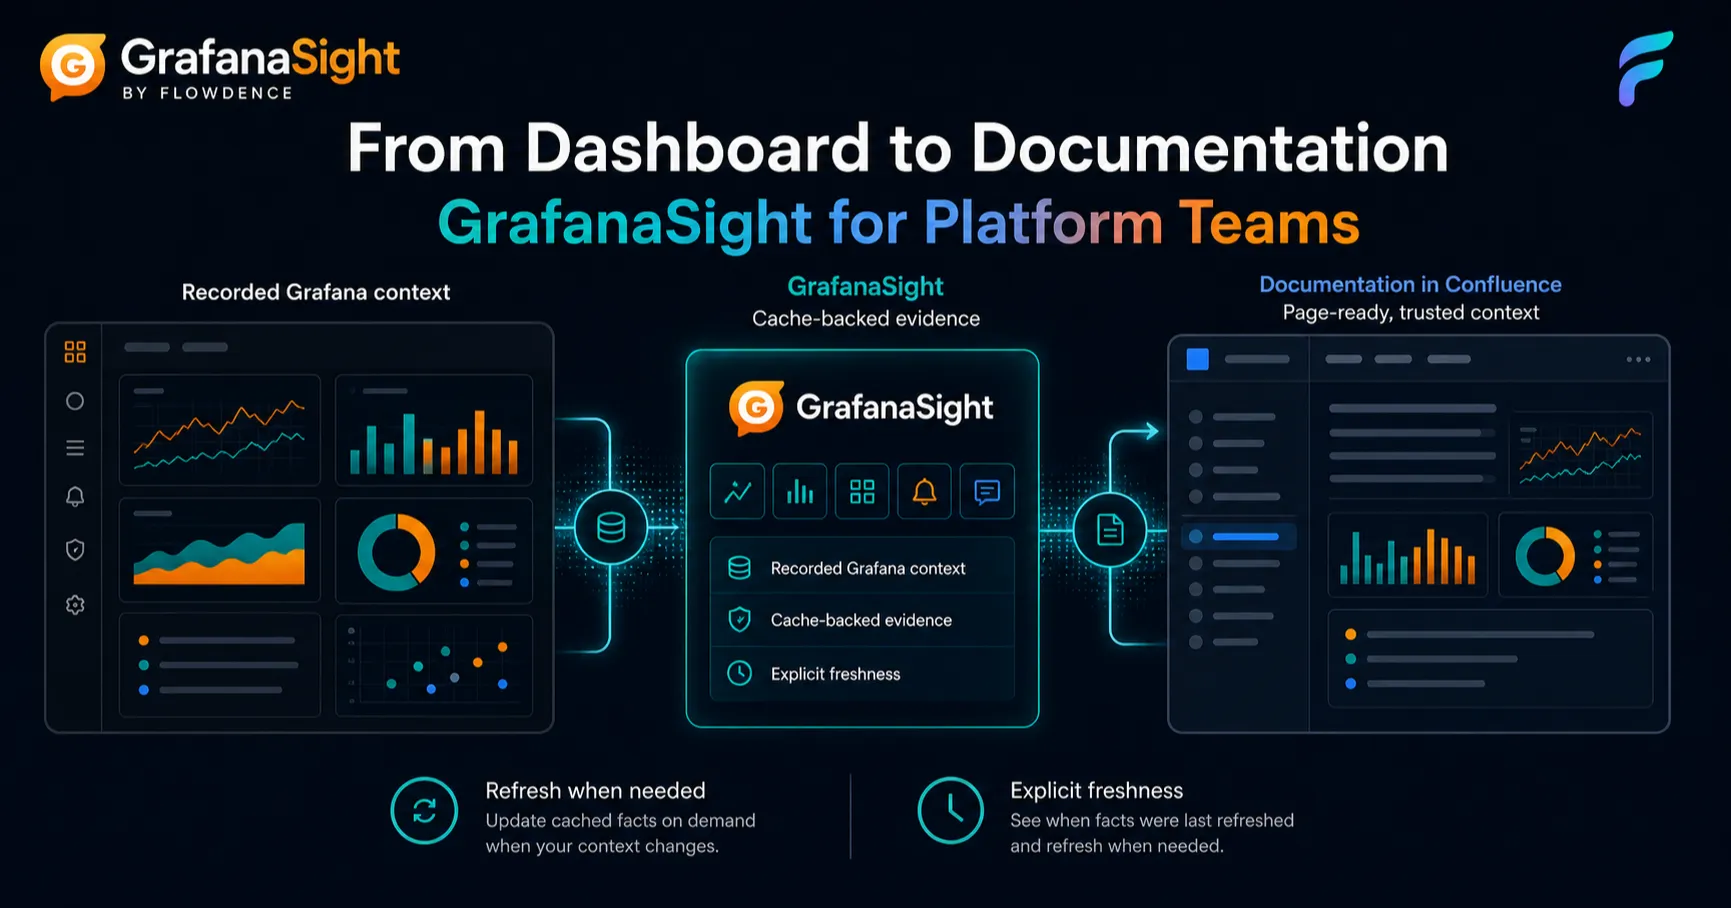
This post is for platform engineers, SREs, and engineering managers who maintain Grafana Cloud or self-hosted Grafana dashboards alongside Confluence documentation — architecture pages, runbooks, service catalogs, and postmortems.
Platform teams live in two worlds. Grafana is where you monitor. Confluence is where you document. The problem is that these two worlds are not connected, and the gap between them creates work, confusion, and risk every single day.
GrafanaSight is a Flowdence product and is not affiliated with, endorsed by, or sponsored by Grafana Labs.
The Two-World Problem
Platform teams are responsible for the observability layer and for the documentation that explains it. In practice this means maintaining dashboards in Grafana and writing architecture docs, runbooks, and service catalog entries in Confluence.
These two systems do not talk to each other. The result is a constant, manual process of translating Grafana state into Confluence content — and that translation is stale the moment it is written.
A runbook describes an alert threshold that was changed last sprint. An architecture page references a dashboard that was reorganized into a different folder. A service catalog entry says “see the Grafana dashboard” with a link that now 404s because someone renamed it.
The root cause is not carelessness. It is that platform teams are asked to maintain two separate representations of the same underlying infrastructure state, and no manual process can keep them synchronized at the rate that infrastructure changes.
GrafanaSight for Confluence bridges this gap. It is a Forge-native Confluence Cloud app that brings dashboards, panels, and alerts from Grafana Cloud or a Forge-reachable self-hosted HTTPS instance into Confluence — not as one-off screenshots, but as refreshable content.
A Browsable Grafana Library in Confluence
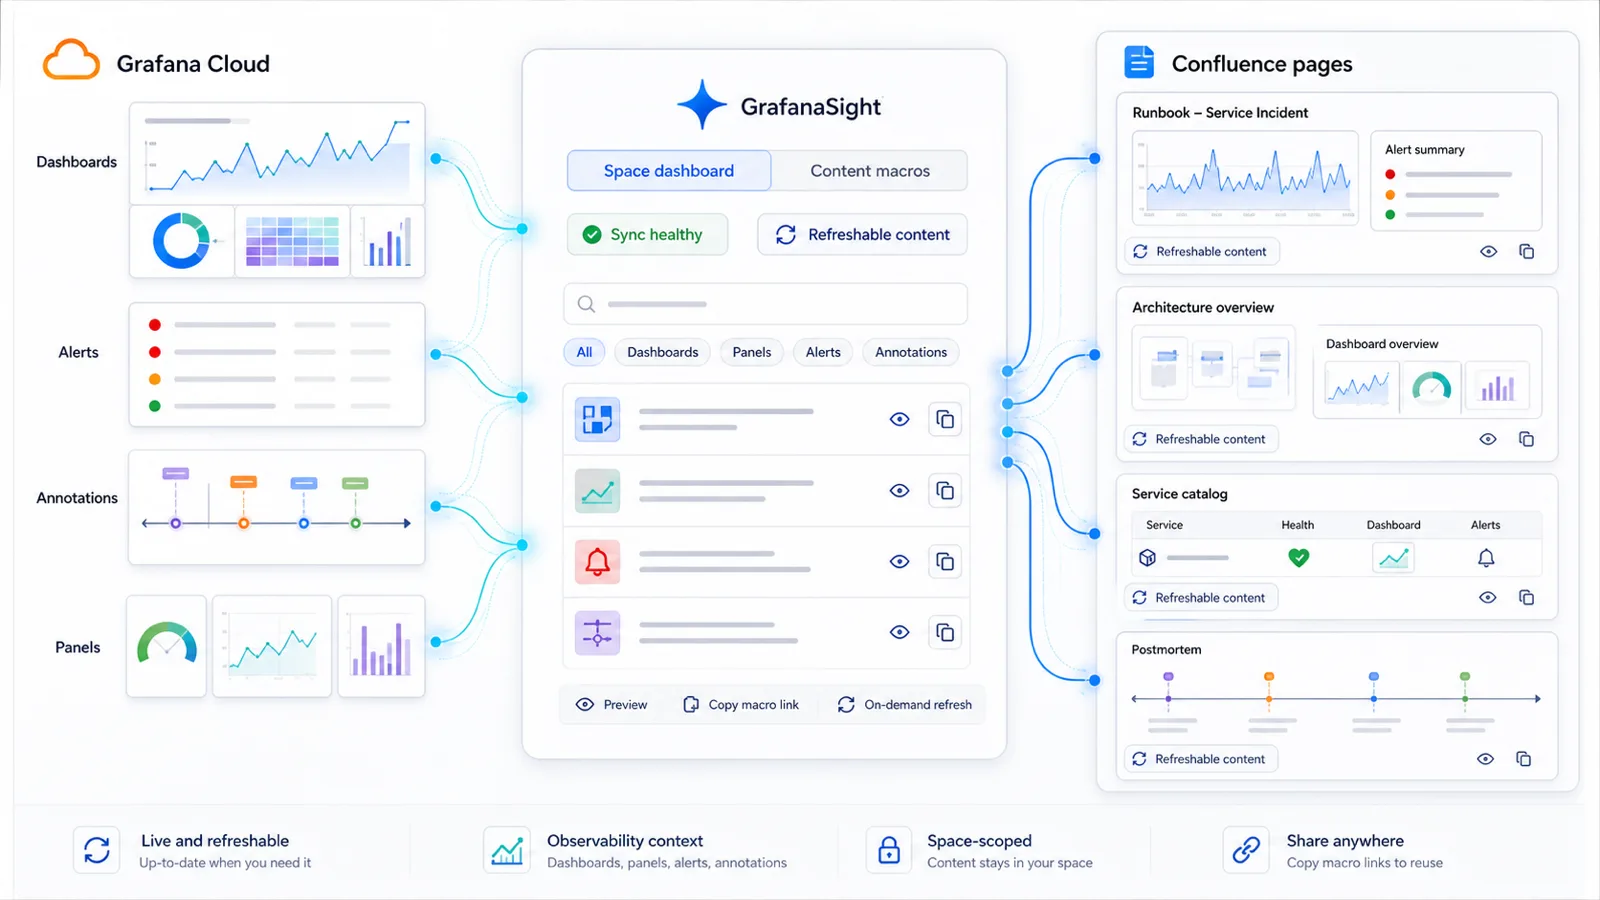
The GrafanaSight Space Dashboard is a two-tab page that gives platform teams a Confluence-native view of their connected Grafana instance.
The Library tab displays dashboards from the connected Grafana instance. You can search by name, filter by folder or tag, and drill into a dashboard to see its panel list. From there, you generate copyable macro links — for a specific panel, a dashboard overview, or an alert summary — and paste them into any Confluence page.
The Alerts tab shows active Grafana alerts with state and severity filtering. Firing, pending, and resolved alerts are visible at a glance, with direct links back to Grafana for engineers who need to dig deeper.
Both tabs include a sync health summary that shows whether background refresh is healthy, when it last ran, whether it succeeded, and how many dashboards and alerts are cached. First-time users see setup guidance that walks them through connecting their Grafana instance.
The Space Dashboard turns Confluence into a browsable interface for your Grafana catalog. Instead of asking “which dashboard should I embed in this page?” and switching to Grafana to find it, you browse the library in Confluence and copy the link directly.
Dashboard overviews and key panels sit next to system design diagrams.
Alert summaries and panel snapshots keep current state beside response steps.
Status badges and health bylines show which services need attention.
Incident-window panels let future readers revisit evidence without relying on screenshots.
Embed Panels in Architecture Docs
Architecture documentation needs context that changes. A service overview page that says “see the latency dashboard” is less useful than one that shows the latency dashboard. GrafanaSight panel macros make this possible.
Paste a Grafana panel URL into a Confluence page, and GrafanaSight auto-converts it into a live panel macro. The macro renders the panel as a snapshot with time range controls — 1h, 6h, 24h, 7d, 30d — so readers can adjust the window without leaving Confluence. Template variables from the original dashboard URL are preserved, and both detailed and compact layouts are available.
For architecture pages, this means embedding the actual error rate panel, the actual latency distribution, and the actual throughput graph alongside the diagrams and design rationale that explain them. Dashboard overview macros — available in detailed and compact variants — show the dashboard name, panel count, tags, and folder for higher-level references.
Platform teams generate these links from the Space Dashboard Library: browse to the dashboard, drill into the panel list, click Copy panel macro link or Copy dashboard macro link, and paste into the architecture page.
Living Runbooks with Live Data
A runbook with static screenshots is a historical artifact. A runbook with live GrafanaSight macros is an operational tool.
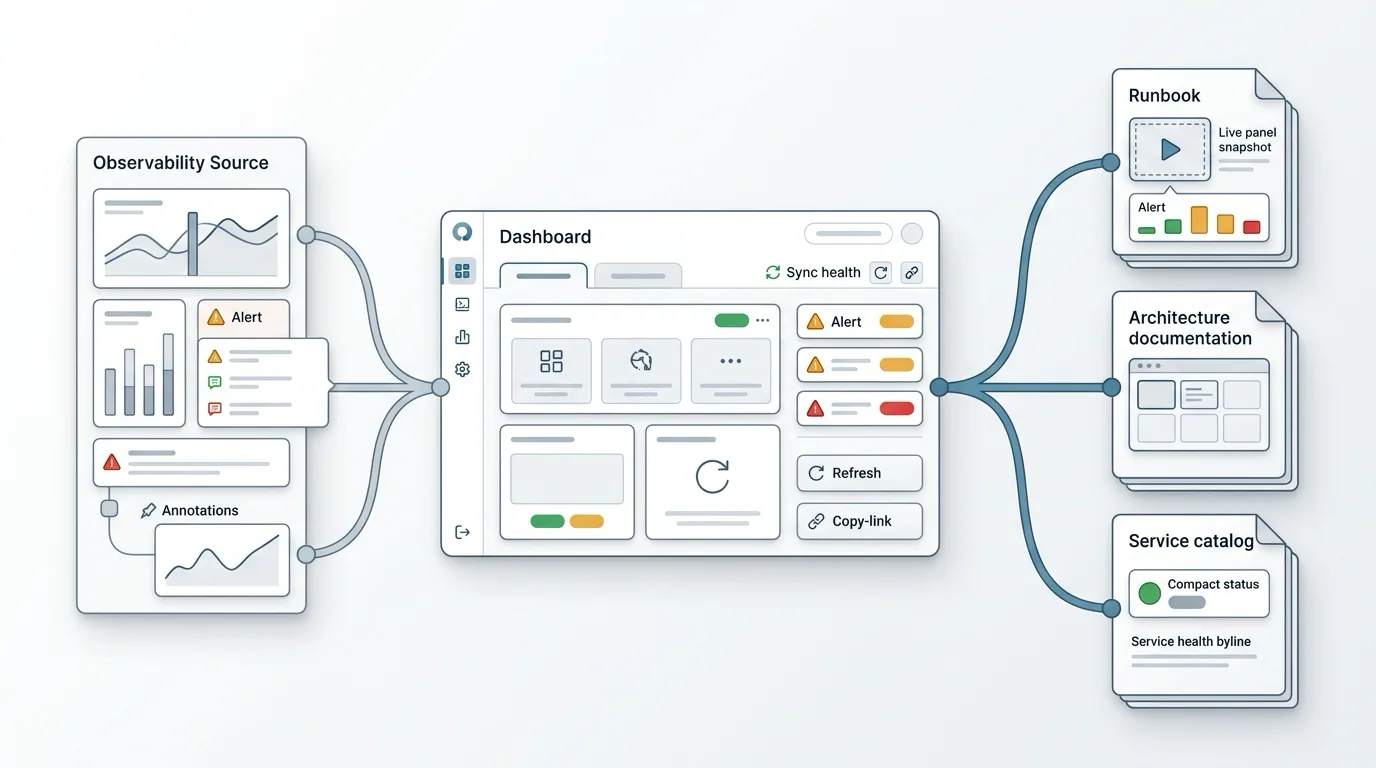
Panel macros show real-time metrics for the services the runbook covers. Alert summary macros display the current state of relevant alerts — firing, pending, or resolved — with severity filtering. The page-level byline enables batch refresh of every GrafanaSight macro on the page with a single click, so an on-call engineer opening the runbook during an incident can refresh all panels to the latest state immediately.
This transforms runbooks from “step 1: open Grafana and check the dashboard” to “look at the panel on this page.” The observability context is embedded directly in the operational instructions, which eliminates context-switching during the most time-sensitive moments.
Service Catalogs with Health Indicators
Internal service catalogs answer the question “what do we run and what state is it in?” GrafanaSight adds the health dimension without requiring catalog readers to have Grafana access.
The Service Health Byline adds a page-header badge showing the current Grafana alert health for the configured service. Readers see health state the moment they open the page, before scrolling to any content. Status badge macros provide inline health indicators — green, amber, or red — that fit naturally alongside service metadata.
For each service entry in the catalog, platform teams can embed a compact dashboard overview macro and an alert summary macro. The result is a service catalog where every entry shows its current health, active alerts, and links to the relevant dashboards — all from Confluence.
Self-Service Visibility
The largest operational benefit of GrafanaSight for platform teams is the reduction in interrupt-driven work.
Product managers, engineering managers, and other non-engineering stakeholders need observability context but do not have — and should not need — Grafana access. Without GrafanaSight, these stakeholders ask platform engineers for status updates, dashboard screenshots, and alert summaries. Each request is a context switch for the engineer and a delay for the stakeholder.
GrafanaSight makes this self-service. Stakeholders open the Confluence page and see panel snapshots, current alert context, and dashboard metadata. The Space Dashboard gives them a browsable library where they can explore dashboards by folder and tag without needing a Grafana login. One Grafana Service Account token, configured by a space admin, serves Confluence readers in that space.
Getting Started for Platform Teams
Setup takes less than five minutes per Confluence space:
- Install GrafanaSight from the Atlassian Marketplace.
- Open Space settings → Integrations → GrafanaSight in the Confluence space where you keep platform documentation.
- Enter your Grafana HTTPS base URL and a Service Account Token with Viewer-level access.
- Save the configuration. If Atlassian prompts for customer-managed egress approval, an Atlassian administrator approves the exact Grafana destination. Then run the first dashboard and alert load.
- Open the Space Dashboard to browse your Grafana dashboards, then start generating macro links.
Each space connects to one Grafana Cloud or Forge-reachable self-hosted HTTPS instance. Credentials are scoped per space and stored in Atlassian-managed encrypted secret storage. Confluence readers do not need individual Grafana logins.
For the full setup guide, macro reference, and Space Dashboard documentation, see the GrafanaSight documentation.
FAQ
How do platform teams use GrafanaSight?
Platform teams use GrafanaSight to embed live Grafana panels in Confluence architecture docs, runbooks, and service catalogs. The Space Dashboard provides a browsable library of all Grafana dashboards with search, tag, and folder filtering. Teams generate copyable macro links from the library to embed specific panels or dashboards in any Confluence page — no need to switch to Grafana to find the right dashboard URL.
What is the GrafanaSight Space Dashboard?
The GrafanaSight Space Dashboard is a two-tab Confluence space page. The Library tab lets teams browse all Grafana dashboards by folder and tag, drill into panel lists, and generate copyable macro links for panels, dashboards, or alert summaries. The Alerts tab shows active alerts with state and severity filters. Both tabs include sync health status and setup guidance for first-time users.
Can GrafanaSight replace Grafana for non-engineering stakeholders?
GrafanaSight is not a Grafana replacement. It surfaces documentation-relevant context — dashboard metadata, panel snapshots, alert status — inside Confluence where non-engineering stakeholders already work. Platform engineers still use Grafana directly for deep analysis. GrafanaSight eliminates the need for stakeholders to request Grafana access or ask platform teams for status updates.
Does GrafanaSight support browsing Grafana dashboards from Confluence?
Yes. The Space Dashboard Library tab displays dashboards from the connected Grafana instance with search, tag, and folder filtering. You can drill into a dashboard to see its panel list, then generate copyable macro links for panels or dashboard overviews to embed in Confluence pages.
Related Posts
- Stop Screenshotting Your Grafana Dashboards
- Incident Postmortems with Live Grafana Data in Confluence
- Grafana Alerts in Confluence: Real-Time Service Health