
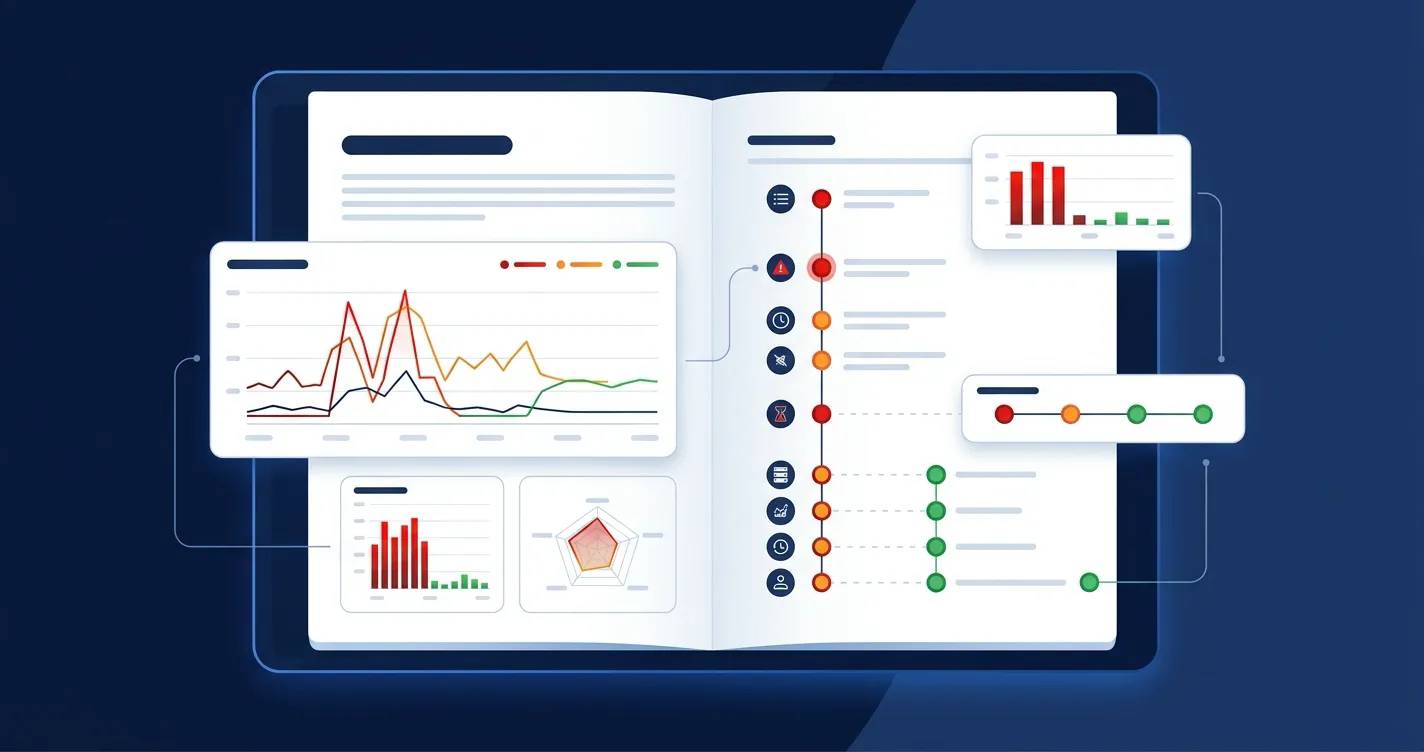
This post is for SRE teams, incident commanders, and reliability engineers who write incident postmortems in Confluence and rely on Grafana for observability data.
If you have ever written a postmortem and spent twenty minutes screenshotting Grafana panels, cropping them, pasting them into a Confluence page, and adding captions that say “latency spike at 14:32 UTC” — you know what happens next. Three weeks later someone opens the postmortem during a similar incident. The screenshots show a time range that does not quite match. The dashboard has been reorganized since then. The panels reference a service name that was renamed. The screenshots are artifacts of a moment, not a window into what actually happened.
This is a fixable problem.
The Screenshot Postmortem Problem
The standard incident postmortem workflow in teams using Grafana and Confluence looks like this:
- Incident is declared. Engineers work in Grafana, PagerDuty, Slack.
- After resolution, someone is assigned the postmortem write-up.
- That person opens the relevant Grafana dashboards, adjusts time ranges to the incident window, screenshots the key panels, and pastes them into a Confluence page.
- They manually transcribe alert timelines, noting which alerts fired and when.
- They write a narrative connecting the visual evidence to the timeline of events.
Every step after step 2 is manual transcription from one system to another. And every piece of transcribed data starts decaying immediately.
Screenshots freeze a single moment. The time range might not perfectly bracket the incident. If you screenshot at now-6h and the incident started 7 hours ago, you have already lost the first hour of context. If you use an absolute time range, the screenshot captures the panel as it rendered at that moment — but dashboard variables, thresholds, and panel queries may have changed since then.
Alert timelines are manually reconstructed. Someone reads through PagerDuty or Grafana alerting history and types up which alerts fired, in what order, with what severity. This is tedious, error-prone, and rarely complete.
Postmortems become stale reference material. When a similar incident occurs six months later and someone pulls up the old postmortem, the screenshots are disconnected from the current monitoring setup. Dashboards have evolved. Panels have been added or removed. The postmortem is a historical document that cannot be verified against current state.
A postmortem that cannot be verified against current data is a story, not evidence. Teams need postmortems that stay connected to the observability stack.
Live Panels Instead of Screenshots
GrafanaSight for Confluence replaces static screenshots with live panel snapshot macros. Instead of pasting an image, you embed a macro that renders a current snapshot of any Grafana panel directly in your Confluence page.
Panel macros support configurable time ranges:
- Relative presets — last 1h, 6h, 24h, 7d, 30d
- Absolute epoch ranges — lock the view to the exact incident window (e.g., 2026-05-15T14:00:00Z to 2026-05-15T18:00:00Z)
For postmortems, absolute time ranges are the key feature. You set the macro to the exact incident window, and it renders that panel for that time range every time the page is viewed. Unlike a screenshot, the rendered image reflects the current state of the panel query — if the dashboard has been updated with better queries or thresholds, the postmortem panel updates too.
Each macro displays a freshness timestamp showing when the data was last fetched. A Refresh button lets anyone re-render on demand. Template variable support means you can scope panels to specific services, regions, or clusters without creating separate macros for each permutation.
If the Grafana instance is unreachable, the macro falls back to the last cached snapshot with a stale-data indicator — the page never goes blank.
Annotation Timelines for Incident Context
Screenshots cannot show deployment events, configuration changes, or manual annotations that happened during the incident window. GrafanaSight’s Annotation Timeline macro can.
The Annotation Timeline macro queries Grafana annotations for a configurable time range and renders them as a chronological event list in Confluence. This surfaces:
- Deployment markers from CI/CD pipelines
- Configuration change annotations
- Manual annotations added by engineers during the incident
- Alert state-change events tagged as annotations
For a postmortem, you scope the Annotation Timeline to the incident window. The result is a factual, timestamped record of every change event that Grafana recorded during the outage — no manual reconstruction required.
AI-Assisted Incident Summaries
Writing the incident narrative is the most time-consuming part of a postmortem. The GrafanaSight Specialist Rovo agent includes a Generate incident summary draft action that gives postmortem authors a structured starting point.
From within Confluence, you ask the agent to generate an incident summary for a named service. The agent assembles a structured draft from the dashboards, alerts, and annotations it has on hand for that service and returns it back to you in seconds. It includes:
- Which dashboards are relevant to the named service
- Which alerts were firing, with severity and label details
- A chronological event timeline from annotations
- A suggested impact summary based on the alert data
This is not a finished postmortem. It is a factual skeleton that the postmortem author can edit, add human context to, and refine. The value is in eliminating the thirty minutes of tab-switching and manual data gathering that precedes the actual writing.
Building a Living Postmortem Template
GrafanaSight macros work well as building blocks for a reusable Confluence postmortem template. Here is a suggested structure:
1. Incident Header — Service name, severity, duration, incident commander. Add a Status Badge macro for the affected service to show its current health state inline.
2. Service Health — A Service Health Byline at the top of the page showing whether the affected service has recovered.
3. Key Metrics — Two to four Panel macros locked to the incident time window. Typical choices: request rate, error rate, latency percentiles, resource utilization.
4. Alert Timeline — An Alert Summary macro filtered to the incident time window, showing which alerts fired, their state transitions, and severity levels. Use label filtering to scope to the affected service.
5. Change Events — An Annotation Timeline macro for the same time window, surfacing deployments, config changes, and manual annotations.
6. AI-Generated Summary — Output from the Rovo agent’s incident summary action, pasted into the page as a starting point for the narrative.
7. Human Analysis — Root cause, contributing factors, action items. This is the part that requires human judgment and cannot be automated.
The difference between this template and a screenshot-based postmortem is that sections 2 through 6 stay connected to Grafana. If a similar incident occurs and someone revisits the page, the panel macros still render, the alert summary is still queryable, and the annotation timeline is still accurate.
Before and After
| Screenshot Postmortem | GrafanaSight Postmortem |
|---|---|
| Static panel images that cannot be updated | Live panel macros locked to the incident time window |
| Manually reconstructed alert timeline | Alert Summary macro with state and severity filtering |
| No record of deployment events during the outage | Annotation Timeline macro showing change events |
| Narrative written from memory and Slack scrollback | Rovo-generated incident draft from cached Grafana data |
| Stale after the first dashboard change | Panels re-render with current queries and thresholds |
| Requires Grafana access to verify claims | Anyone with Confluence access can see the data |
Security and Data Handling
GrafanaSight runs on Atlassian Forge — Atlassian’s serverless compute platform — with no Flowdence-operated servers in the data path. App processing and cached data stay on Atlassian infrastructure. Read-only requests go directly from Forge to the exact Grafana Cloud or self-hosted HTTPS destination an Atlassian administrator approves.
All Grafana credentials are stored in Atlassian-managed encrypted storage. GrafanaSight uses a cache-first architecture with explicit freshness timestamps on every macro, so you always know how current the displayed data is.
GrafanaSight is a Flowdence product and is not affiliated with, endorsed by, or sponsored by Grafana Labs.
FAQ
Why are Grafana screenshots problematic in incident postmortems?
Screenshots capture a single point in time and cannot be updated after the fact. The time range may not perfectly cover the incident window. Panels may be cropped or rendered at low resolution. There is no way to drill down into the data from the postmortem page. As dashboards evolve — queries are tuned, panels are reorganized, thresholds are adjusted — the screenshots become disconnected from the current monitoring setup. During a future incident, referencing an old postmortem with stale screenshots means working with evidence that may no longer represent how the system is monitored.
How does GrafanaSight improve incident postmortems in Confluence?
GrafanaSight lets you embed live Grafana panel snapshots, alert summaries, and annotation timelines directly in Confluence postmortem pages. Panel macros render current images with configurable time ranges — including absolute ranges locked to the incident window. The Annotation Timeline macro shows deployment and change events that occurred during the outage. The Alert Summary macro surfaces which alerts were firing, with filtering by state, severity, and labels. The Rovo agent can generate structured incident summary drafts from cached dashboard and alert data, giving authors a factual starting point.
Can GrafanaSight show what happened during a specific time window?
Yes. Panel macros support both relative presets (last 1h, 6h, 24h, 7d, 30d) and absolute time ranges specified as epoch timestamps. For postmortems, absolute time ranges are the typical choice — they lock the panel view to the exact incident window. The Annotation Timeline macro can also be scoped to a specific time window to show only the change events that occurred during the incident.
Does the Rovo agent help with incident postmortems?
Yes. The GrafanaSight Specialist Rovo agent has a Generate incident summary draft action. It reads from GrafanaSight’s cached data — dashboard metadata, active and recently resolved alerts, and annotation snapshots — and returns a structured incident summary with timestamps, affected dashboards, alert details, and a chronological event timeline. This gives postmortem authors a factual skeleton to build on, eliminating the manual data-gathering phase that typically precedes writing.
Related Posts
- Stop Screenshotting Grafana Dashboards
- Grafana Alerts in Confluence: Real-Time Service Health
- From Dashboard to Documentation: GrafanaSight for Platform Teams