
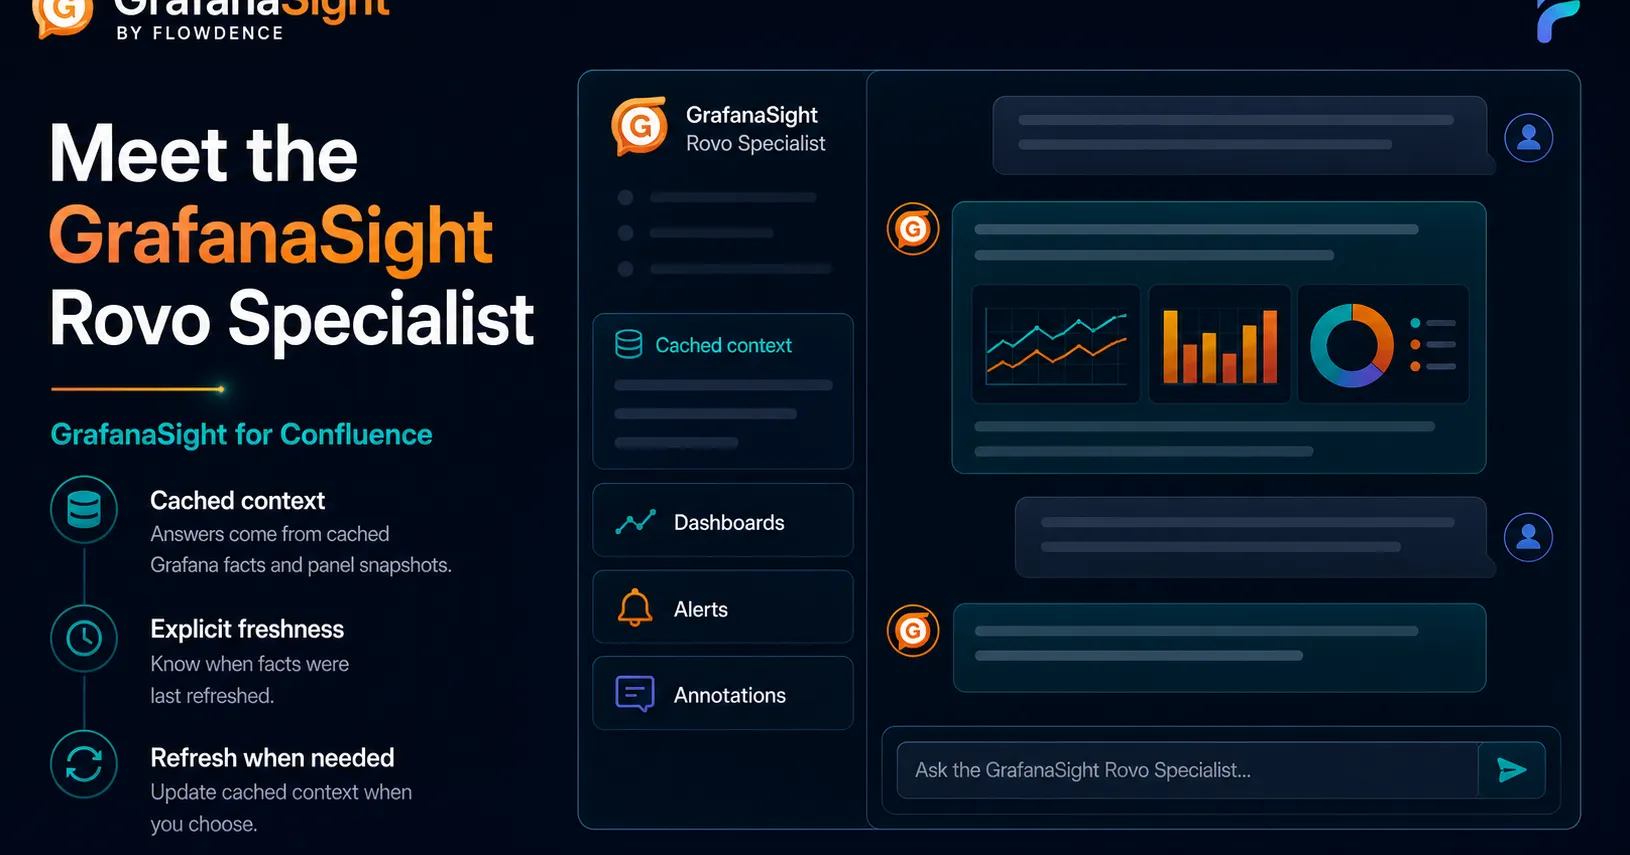
This post is for Confluence users on Premium or Enterprise plans who want to query their connected Grafana environment using natural language, without leaving Confluence or logging into Grafana.
Most teams have two kinds of people: those who live in Grafana and know exactly which dashboard to open, and everyone else. The second group — product managers, incident commanders during triage, new engineers ramping up, leadership checking service health — needs answers from Grafana but does not have the muscle memory to navigate it. They ask the platform team. They wait for someone to paste a screenshot in Slack. They check a Confluence page that may or may not be current.
The GrafanaSight Specialist Rovo agent closes this gap. It is a practical Atlassian Rovo custom agent example for Confluence teams: a specialist that answers natural language questions about your connected Grafana environment from anywhere in Confluence, grounded in your actual dashboard and alert data, not general knowledge.
Note: GrafanaSight is a Flowdence product and is not affiliated with, endorsed by, or sponsored by Grafana Labs.
Atlassian Rovo Custom Agent Example: GrafanaSight
The GrafanaSight Specialist exposes four capabilities through Atlassian Rovo:
Query cached dashboards. Search dashboards by name, tag, folder, or topic. Drill into panel lists for a specific dashboard. Filter by folder or tag. The agent reads from GrafanaSight’s cached catalog, which is refreshed in the background from the connected Grafana instance.
Query cached alerts. Ask about firing, pending, or resolved alerts. Filter by severity, label, or free-text search. The agent reads from recently refreshed alert data and reports how fresh that data is in every answer.
Refresh the cache on demand. If the data feels stale, ask the agent to refresh dashboards, alerts, or both. This triggers a live fetch from the connected Grafana instance and updates the cache.
Generate incident summary drafts. Provide a dashboard UID, service name, or topic and the agent assembles a structured incident summary from cached dashboard metadata, active alerts, and annotation snapshots. This gives postmortem authors a starting point grounded in data rather than memory.
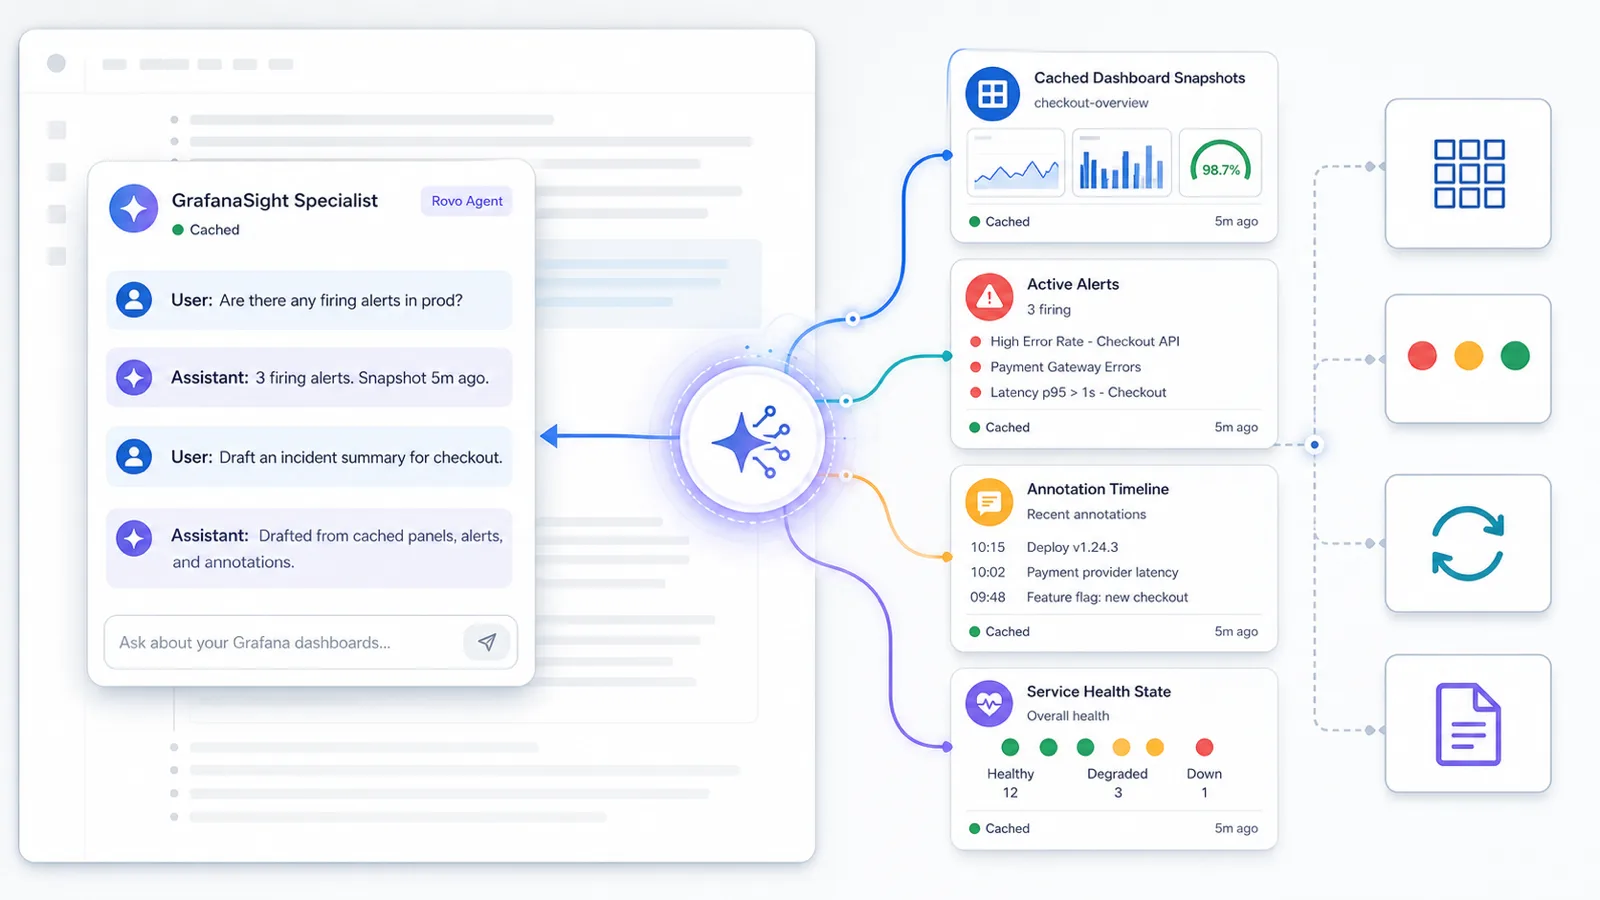
Example Conversations
The agent is designed for practical operational questions, not open-ended analytics:
| You ask | The agent answers |
|---|---|
| Are there any firing alerts in production? | Lists firing alerts with names, durations, and labels. Reports cache timestamp. |
| Show me dashboards tagged “payments” | Returns matching dashboards with panel counts, folders, and tags. |
| What panels does the Checkout Latency dashboard have? | Lists panels by title, type, and data source. |
| How fresh is the GrafanaSight cache? | Reports last catalog sync and last alert sync timestamps. |
| Refresh the alert data | Triggers a live fetch from the connected Grafana instance and confirms completion. |
| Generate an incident summary for the payments service | Assembles a structured draft from alerts, dashboard context, and annotations. |
Non-Hallucination Guardrails
The agent is not a general-purpose AI assistant that happens to know about Grafana. It is bound to the data GrafanaSight has cached:
- Freshness transparency. Every answer includes a snapshot timestamp. If the cache is 45 minutes old, the agent says so.
- Explicit unknowns. If the agent cannot answer from cached data, it says “I don’t have data for that” rather than guessing. It recommends refreshing or checking the dashboard directly.
- No metric queries. The agent does not have direct access to Grafana’s metric query APIs. It works with dashboard metadata, alert state, and annotations — not raw time series data. If you ask about p99 latency trends, it tells you which dashboard and panel to check, not the number.
- Cache-first by default. Queries read from the local cache, which reduces Grafana API load and keeps responses fast. Live refreshes are explicit and user-initiated.
Tip: Think of the GrafanaSight Specialist as a knowledgeable colleague who knows your dashboard inventory and current alert state — not as a metrics query engine.
Four Things the Agent Can Do
Each capability is scoped to the Confluence space the agent is invoked in. The agent only sees data the space has been configured to access — it cannot reach across spaces or read anything outside the configured Grafana connection.
Who Benefits
On-call engineers during triage can ask “what alerts are firing right now?” without switching to Grafana or waiting for someone else to check.
Incident commanders can generate incident summary drafts during or after an incident, getting a structured starting point instead of a blank page.
Product managers can check service health during release windows: “are there any alerts related to the checkout service?”
New team members can explore the monitoring landscape: “show me all dashboards tagged infrastructure” — and get oriented without needing Grafana training.
Documentation authors can find the right panels to embed: “what panels does the API Gateway dashboard have?” — and then copy macro links from the Space Dashboard.
Requirements
The GrafanaSight Specialist Rovo agent requires:
- Confluence Premium or Enterprise — Rovo is available on these plans
- GrafanaSight configured for the space — a Grafana Service Account token must be connected to Grafana Cloud or a Forge-reachable self-hosted HTTPS instance
- At least one successful sync — the agent needs cached data to answer questions
The agent is available automatically once GrafanaSight is installed and configured. No separate setup is needed.
Getting Started
- Install GrafanaSight for Confluence from the Atlassian Marketplace.
- Configure your Grafana connection in Space Settings. An Atlassian administrator approves the exact HTTPS destination when prompted.
- Run an initial sync to populate the dashboard and alert cache.
- Open the Rovo agent from anywhere in Confluence and start asking questions.
Conversation starters to try:
- “Are there any firing alerts in prod?”
- “Show me dashboards tagged payments.”
- “What dashboards do we have for checkout?”
- “How fresh is the GrafanaSight cache?”
For full documentation, see the GrafanaSight docs.
FAQ
What is an Atlassian Rovo custom agent example?
The GrafanaSight Specialist is an example of an Atlassian Rovo-powered specialist agent for Confluence. It answers natural language questions about Grafana dashboards, alerts, cache freshness, and incident-summary context using GrafanaSight data already connected to the Confluence space.
What is the GrafanaSight Specialist Rovo agent?
The GrafanaSight Specialist is an Atlassian Rovo agent that answers natural language questions about your connected Grafana environment from anywhere in Confluence. It queries cached dashboard metadata, alert summaries, and annotation data — not live metrics — and reports freshness timestamps with every answer. It requires Confluence Premium or Enterprise.
What can I ask the GrafanaSight Specialist?
You can ask about firing alerts, dashboard metadata, panel counts, folder organization, dashboard tags, and service health. The agent can also generate structured incident summary drafts from cached data. It cannot query raw time series metrics — it works with dashboard and alert metadata.
Does the Rovo agent query Grafana in real time?
By default, the agent queries GrafanaSight’s cached data, not live Grafana APIs. This is faster and avoids unnecessary API load. If you need fresher data, you can ask the agent to refresh the cache, which triggers a live fetch from the connected Grafana instance.
Can the Rovo agent hallucinate or make up Grafana data?
The agent includes non-hallucination guardrails. If data is stale or unavailable, it says so and recommends refreshing. Every answer includes a snapshot timestamp so you know how current the data is. If the agent cannot answer a question from cached data, it tells you rather than guessing.
Related Posts
- Stop Screenshotting Your Grafana Dashboards
- Incident Postmortems with Live Grafana Data
- Grafana Alerts in Confluence: Service Health